|
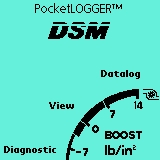
Tap "Datalog" to view or collect live data
Tap "View" to view saved logs.
Tap "Diagnostic" to check stored errors, test ECU inputs and actuators.
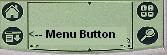
From the main screen tap the menu button again and tap the "Preferences" menu item.
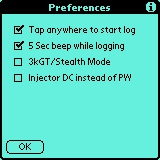
Tap anywhere to start log
When checked, you can tap almost anywhere on the screen to start and stop a log, instead of tapping the small "GO!" button.
5 Sec beep while logging
When checked, Palm will beep every 5 seconds while logging, reminding you that you are recording data.
3kGT/Stealth Mode
Check this when using PocketLOGGER on a 3000GT or Stealth.
Injector DC instead of PW
When checked, the Palm will display Injector Duty Cycle instead of Pulse Width.*
* In order for Duty Cycle to be displayed, RPM and injector pulse width must be logged or the display will default to pulse width regardless of the preference setting.
Tap the Menu button, then the "Trigger and Alarm" menu item.
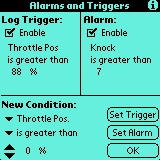
Trigger and Alarm
Setting a Trigger will automatically start datalogging when a condition is met. The Alarm will make the Palm beep when a condition is met.
To set an Alarm or Trigger condition:
- In the "New Condition" section, set the parameters of the condition you wish to activate the alarm or trigger.
- Tap "Set Trigger" or "Set Alarm" to make the New Condition parameters the Alarm or Trigger parameters.
Tap the "Enable" checkbox for either Alarm or Trigger to activate the respective feature.
Please note that if you are not logging the parameter chosen for an Alarm or Trigger, the feature will not work.
Tap "OK" when done.
From the Main menu, tap "Datalog".
Tap the ![]() icon to display the Parameter Select Screen.
icon to display the Parameter Select Screen.
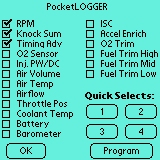
On the selection screen, tap the checkboxes of the parameters you wish to log or tap one of the four QuickSelect buttons.
QuickSelects
To program the QuickSelect Buttons:
- Tap the checkboxes of the parameters to save
- Tap the "Program" button
- Tap the QuickSelect you wish to program
The next time that QuickSelect is tapped, the checkboxes will be set to the configuration that you programmed.
Tap OK when done.
Check the connection status in the upper right hand corner.
 = connection not established
 = connection established
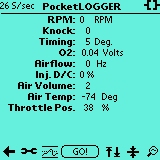
Once a connection has been established, you will see data scroll across the screen if in Graph mode, or the sensor values updated if in Number mode. As long as the connection is good, data will be updated. Just because the data is being updated on the screen does not mean that data is being stored.
At this point you can:
Tap the "GO!" button to start storing data.
Tap the "STOP" button to stop storing data.
Arming
If you have the Trigger enabled, when you tap the "GO!" button, the button will change to "ARMED" if the Trigger condition you set is not currently true. Armed means PocketLOGGER is currently waiting for the Trigger condition to be met. When the condition turns true, or it was true when you tapped the "GO!" button, the log will automatically start.
Autoname and Save
Logs are automatically named with a date/time stamp and saved when the "STOP" button is pressed. Logs that are under 5 seconds are discarded.
Tap the  icon to switch to the Number View Screen.
Log from the Number View Screen
The number screen has a "GO!" button as well as the graph screen. You can log from the Number View screen just like you do on the graph screen.
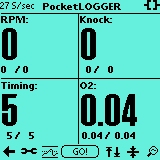
Big Number View
If you are logging 4 or less parameters, the numbers are displayed in a large font.
Min/Max Memory
Under each large number is a set of numbers that indicate the minimum and maximum value for that parameter since last reset.
Tap the  icon to reset the Min/Max memory.
If you are logging more than 4 parameters, the View Number screen displays small numbers. Use the  icon to toggle between live data and Min/Max values.
Tap the  icon to switch back to the graph screen.
Tap the  icon to view a list of saved logs.
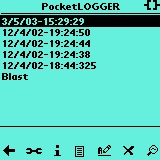
Log List
By tapping the icon from either Datalog screens or tap "View" from the main screen, the Log List screen is displayed. Highlight a log by tapping it's name and then one of the following icons:
 |
- to go back to the previous screen |
 |
- to view information about the log |
 |
- to view or edit the note attached to the log |
 |
- to rename a log |
 |
- to delete the log |
|
- to view the log |
Viewing the Log
By tapping the icon from the Log List screen, you view the log that was highlighted.
  |
- Jump to the beginning or end of the log |
  |
- Scroll the log to the right (back) or left (forward) |
 |
- Change the currently viewed parameters (only if there's more than three) |
|
- Go back to the previous screen |
|
- View the note attached to the log |
 |
- Toggle between slider and arrows |
Use the hard Page Up/Page Down buttons to zoom the log in and out.
Slider Control
Use the slider to jump to any spot in the log.
As you slide the slider, the log time will be updated to reflect the position in the log, but the screen will not be updated until the slider is released.
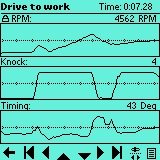
Getting Parameter Values
While viewing a graphical representation of an engine parameter is nice, in reality it's pretty useless without knowing real numbers. To get the values at any point in the log, just tap! Tap the screen at any point in the log and the actual values will be displayed on the right side above each graph window, including the time in the upper right hand corner. This is where the zoom comes in handy. You can drag your stylus across the screen and the actual values are displayed in real time. If you drag your stylus to the edge of the screen, the log automatically scrolls in that direction.
Sticky Logs
By tapping the name of a Parameter, this will move the parameter's graph to the top of the screen and 'stick' it in place. A small lock icon will appear next to the name of sticky logs. You can make up to two logs 'sticky'. When a log is sticky, it does not move even when the and ![]() buttons are used. This allows you to compare any three parameters.
buttons are used. This allows you to compare any three parameters.
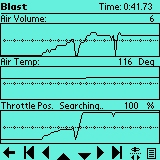
Search
By tapping the numbers in the upper right corner of the graph of a particular parameter, "Searching..." will appear above the graph. Drag the stylus on the graph. You will see the numbers change in relation to the up/down position of the stylus on the graph. Drag the stylus until the number reads the value you want to search for and release. The log will jump to the next point that crosses the point at which you released the stylus, with the point displayed in the center of the screen. Searches always start from the center of the current screen.
By tapping or releasing the stylus outside of the graph that the search is activated for, the search is canceled.
Example: If you wanted to search for when throttle position is greater than 50%, scroll so the Throttle Position graph is displayed. Tap the number area of the Throttle Position graph. "Searching..." is displayed. Tap the graph at the mid point. The graph will jump to where the TPS is at 50%. (See image on left).
At this point, if you were to search again, the log would jump to the point at which the TPS drops below 50%. Searching looks for a CROSSING point, not an above or below condition.
The diagnostic section consists of three screens.
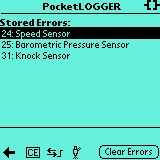
Check Errors
Tap the  icon to view the error screen. Any errors stored in the ECU will be displayed in the list.
Tap the "Clear Errors" button to clear the error memory (Does not work on 1990 ECUs)
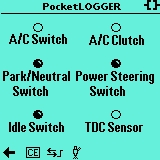
ECU Input
Tap the  icon to view the ECU Input screen. Use this screen to test the operation of the ECU switch inputs.
This screen will have different parameters displayed when in 3kGT mode.
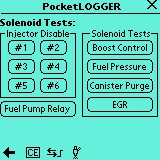
Actuators
Tap the  icon to go to the Actuator test screen. Use this screen to test the operation of various actuators connected to the ECU.
Injector Disable - Tap the number of the injector to momentarily disable(car must be running)
Solenoid Tests - Tapping a button will momentarily activate the associated solenoid (car must not be running)
Fuel Pump Relay - Momentarily energizes the fuel pump relay (car must not be running)
©2003 digital tuning, inc.